Date: Thursday, October 15, 2020
Victoria, BC – This week, we look at the Crime Rate as part of our Open VicPD efforts to be as transparent and accountable as possible as we continue our deeper dive into our interactive VicPD Community Dashboard.
The Crime Rate is one of fifteen measures on our Community Dashboard, which, along with our online quarterly reports, publications, and other information are part of Open VicPD, and are how we are telling the story of working towards our strategic vision of “A Safer Community Together.”

Crime Rate – Community Dashboard
The Crime Rate compliments measures like Calls for Service and the Crime Severity Index, in helping to determine both how busy the Department is and how serious crimes occurring in Victoria and Esquimalt are.
What is the Crime Rate?
Created by Stats Canada, the Crime Rate is a per 100,000 persons measure designed to create population by population comparisons. It measures the numbers of police-reported crimes, adjusted to a standard 100,000 person population and excludes traffic offences. Thus, it allows comparisons across different regions in B.C. and across Canada.
Similar to the Crime Severity Index it is an annual measure which allows both region to region and year to year comparisons. We report our Crime Rate information to Stats Canada annually as part of the Uniform Crime Reporting Survey.
Is the Crime Rate just the total number of crimes?
It is important to note that the Crime Rate numbers do not reflect the total amounts of crimes VicPD officers and staff responded to. VicPD serves both Victoria and Esquimalt and our combined population is over 100,000. Again, traffic offences are also not included. As it is an annual measure, the latest Crime Rate data is from 2018.
Census Metropolitan Area vs. Victoria and Esquimalt
Stats Canada reports Crime Rate both for our combined area of responsibility of Victoria and Esquimalt and for the Census Metropolitan Area or CMA. The Victoria CMA includes municipalities outside of Victoria and Esquimalt. In past years this reporting has caused confusion about what the crime rate is. The numbers reported below are for Victoria and Esquimalt only.
Our Community Dashboard displays the Crime Rate in four different ways.
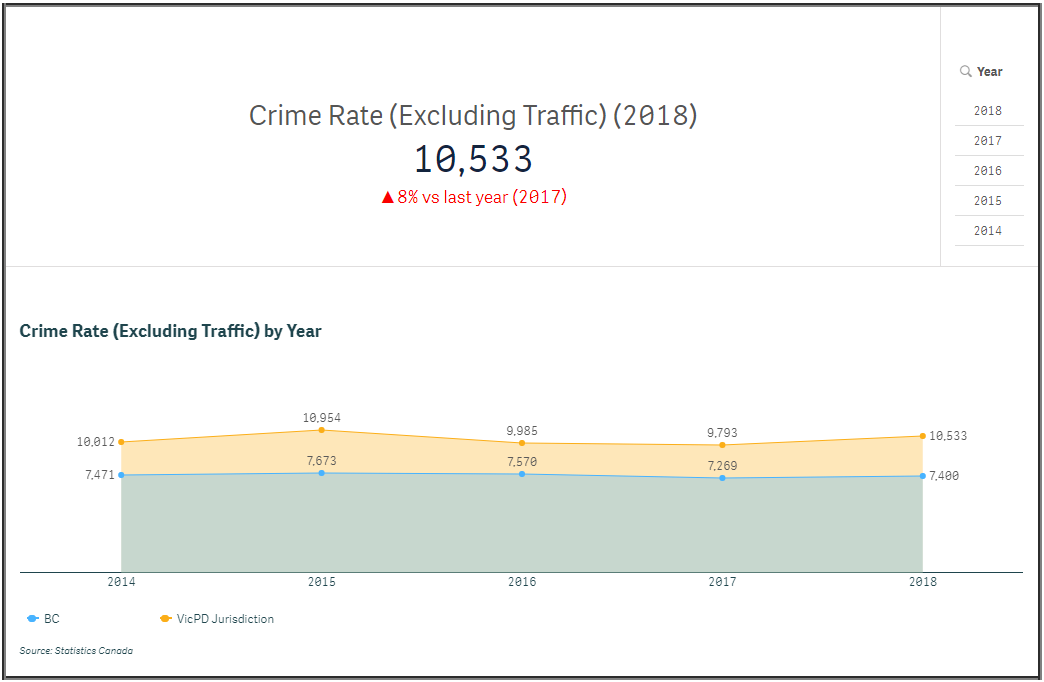
The first Crime Rate graph displayed is the complete measure – although Crime Rate excludes traffic offences. This full measure includes both violent and non-violent crimes and their trends over the last five years. This measure also includes a comparison to the B.C. overall Crime Rate, which is a good benchmark to know whether we are above, below, or on par with the rest of the province. As with similar graphs in the Community Dashboard, the lines show the year to year trend. Hovering over the point in time dots reveals the specific number of calls for service for each individual year.
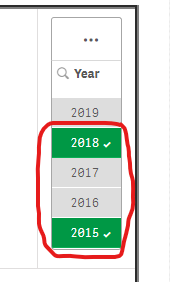
The “Year” menu in the upper right hand corner allows you to select specific years.
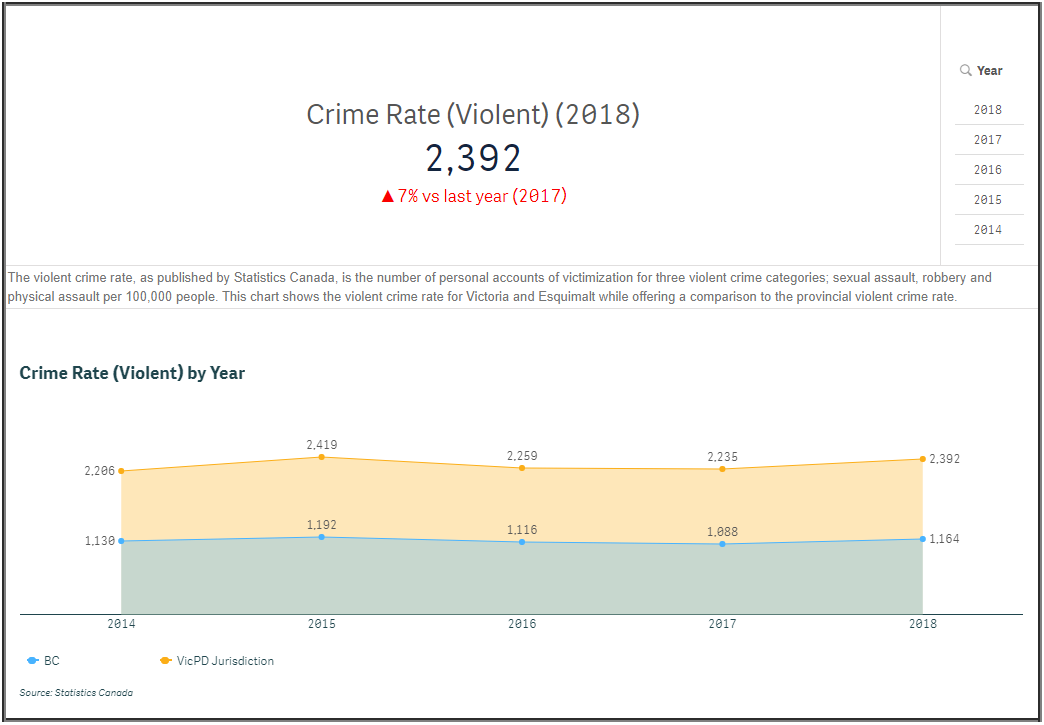
Crime Rate measures are also broken out into three additional subset graphs, determined by crime subtypes of violent, property crime and other. The first subset graph displays the violent Crime Rate; the number of personal accounts of victimization for three violent crime categories; sexual assault, robbery and physical assault per 100,000 people. This chart shows the Violent Crime Rate for Victoria and Esquimalt while offering a comparison to the provincial Violent Crime Rate.
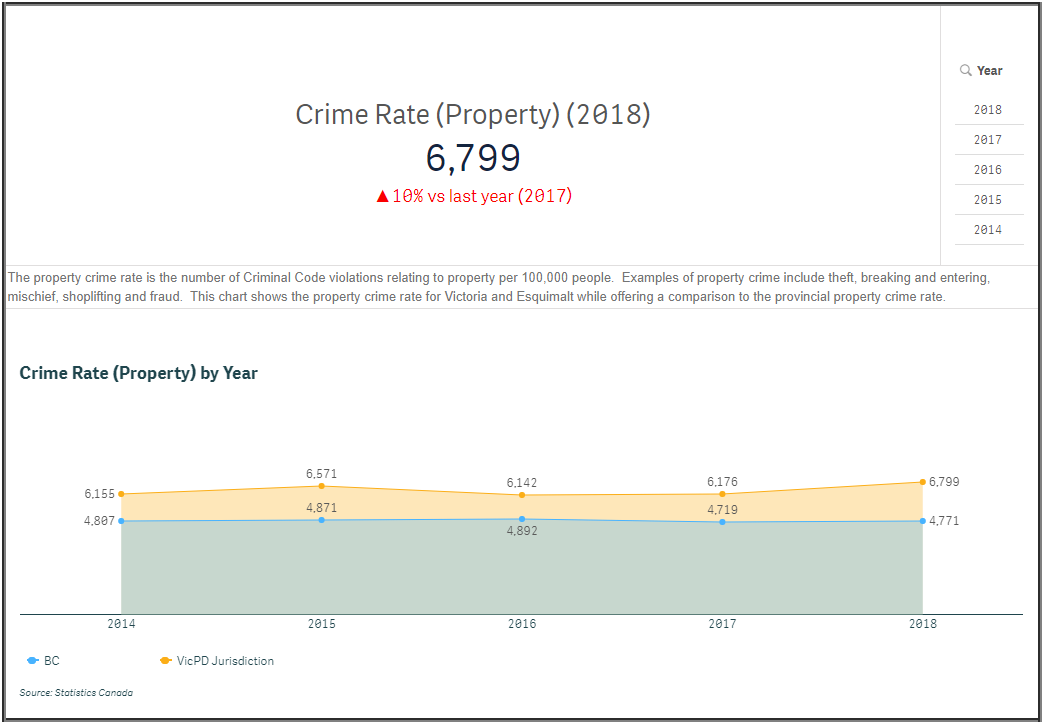
The second subset graph displays the Property Crime Rate. The Property Crime Rate is the number of Criminal Code violations relating to property per 100,000 people. Examples of property crime include theft, breaking and entering, mischief, shoplifting and fraud. This chart shows the Property Crime Rate for Victoria and Esquimalt while offering a comparison to the provincial Property Crime Rate.
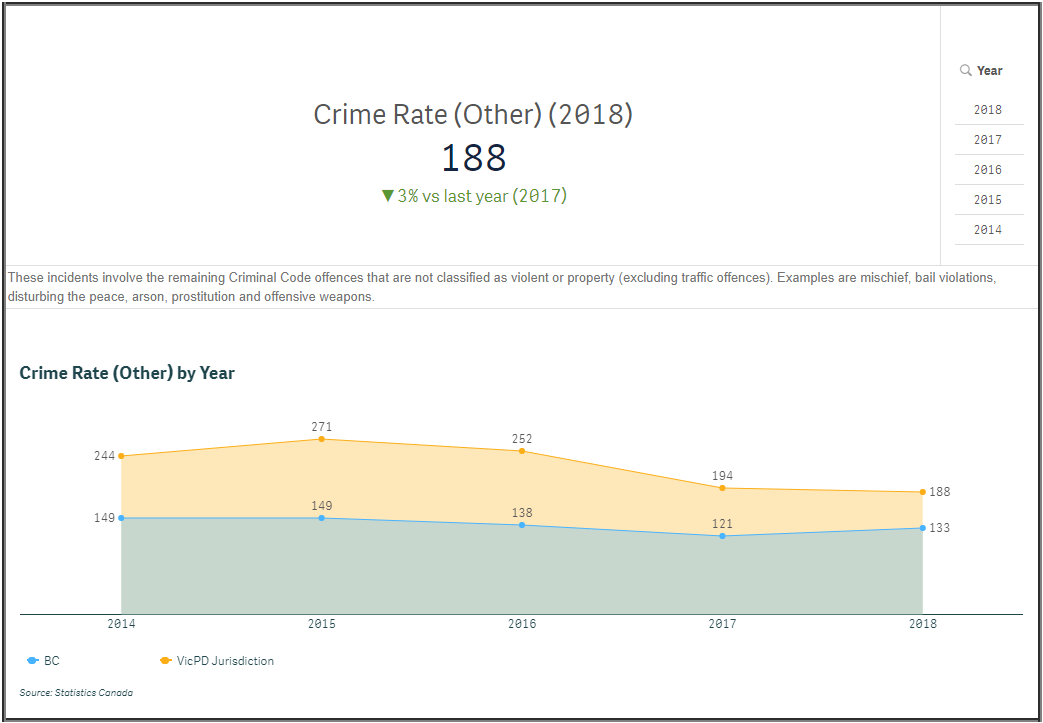
The third subset graph displays the Crime Rate for Other offences. These incidents involve the remaining Criminal Code offences that are not classified as violent or property (excluding traffic offences). Examples are mischief, bail violations, disturbing the peace, arson, prostitution and offensive weapons, per 100,000 people. This chart shows Crime Rate for Other offences for Victoria and Esquimalt while offering a comparison to the provincial Property Crime Rate.
We Want to Hear From You!
As part of our goals to improve your understanding of how we work and what measures we’re using and why, we welcome your feedback. Please email us your questions and suggestions.
Up Next
Next week, we take a closer look at a measure generated by our own VicPD Community Survey; Perception of Crime.
Each week we’re looking at one of our Open VicPD Community Dashboard measures in detail to help you understand what we’re measuring, why we’re measuring it and how we think it helps you track our progress towards achieving our goals.
Join us on Twitter, Facebook, Instagram and VicPD.ca to come along for a deeper dive into Open VicPD.
-30-