Date: Wednesday, September 30, 2020
This week, as part of our Open VicPD efforts to be as transparent and accountable as possible, we begin our deeper dive into our interactive VicPD Community Dashboard as we explore Calls for Service.
Our Community Dashboard, along with our online quarterly reports, publications, and other information are part of Open VicPD, and are how we are telling the story of working towards our strategic vision of “A Safer Community Together.”
 Calls for Service – Community Dashboard
Calls for service are a key measure of how busy the Department is. So much so, they are covered by the Quarterly Reports in three-month snapshots, while compared year-to-year in our Community Dashboard. We covered Calls for Service in the Quarterly Reports last week.
What is a Call for Service?
A call for service is a request that generates any action on the part of VicPD or a partner agency performing work on behalf of the police department (such as E-Comm 911). A call for service is not generated for proactive activities unless the officer generates a specific call for service report. However, individual calls for service can vary greatly in terms of complexity and the time required to effectively manage them. A call for a barricaded person which requires a many hours-long response from many specialized units is much different than a response to a located bicycle. As such, Calls for Service are a great starting point as they measure how many calls we are responding to, but they do not measure the resources each individual call requires.
E-Comm 911 and removing Abandoned 911 Calls for Service in 2019
The Calls for Service chart shows the total number of calls received each year. You’ll note a decline in calls for service between 2018 and 2019. One of the key factors in this decline was our 2019 transition to E-Comm 911. A number of changes in how calls for service are received, classified, and tracked occurred at this time. Importantly, in mid-2019, Abandoned 911 calls were no longer classified as a Call for Service unless an officer was dispatched. This change has a large impact. In 2017, we received over 7,300 Abandoned 911 calls. That’s 13% of Calls for Service in 2017!
As a result of these changes, a direct comparison of trends regarding calls for service beginning in 2019 compared with previous years is not possible.
The lines show the year to year trend. Hovering over the point in time dots reveals the specific number of calls for service for each individual year.
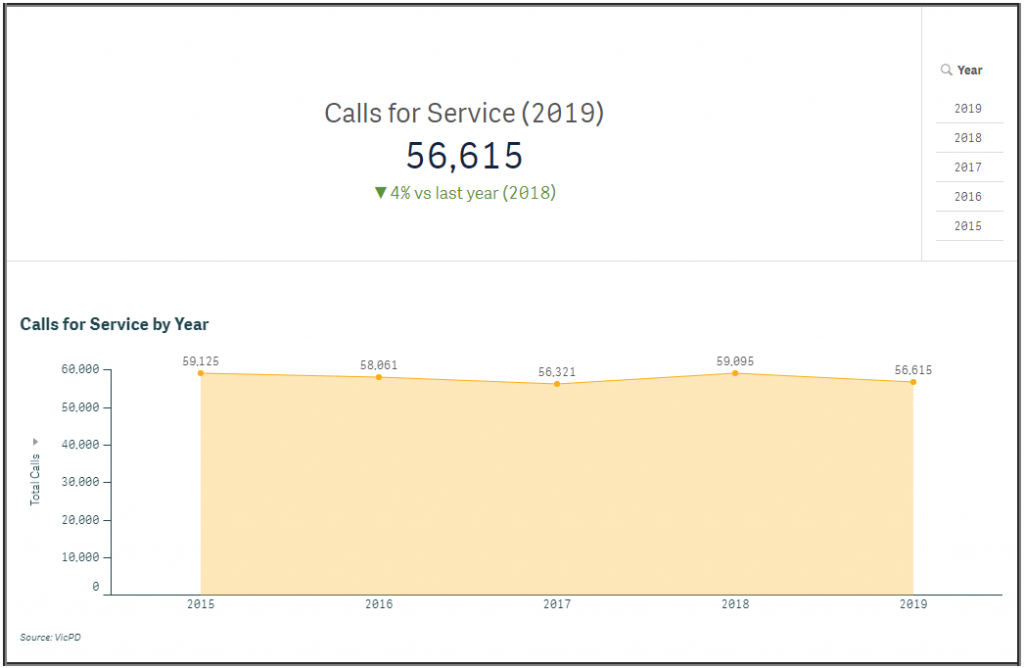
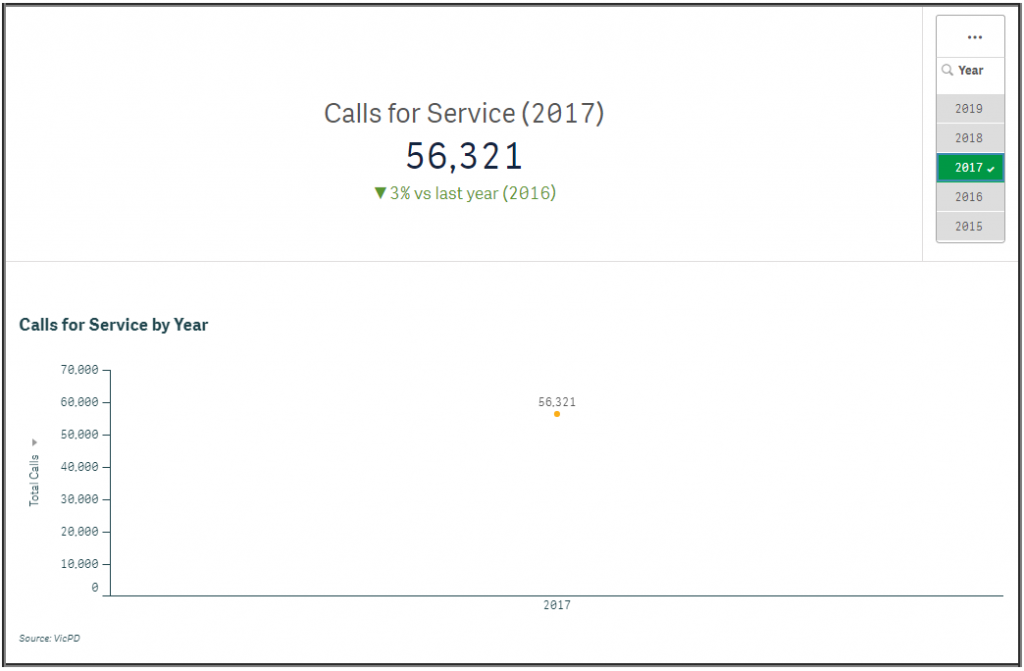
The “Year” menu in the upper right hand corner allows you to select specific years.
You can also select and view individual years.
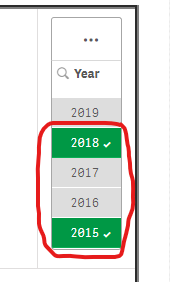
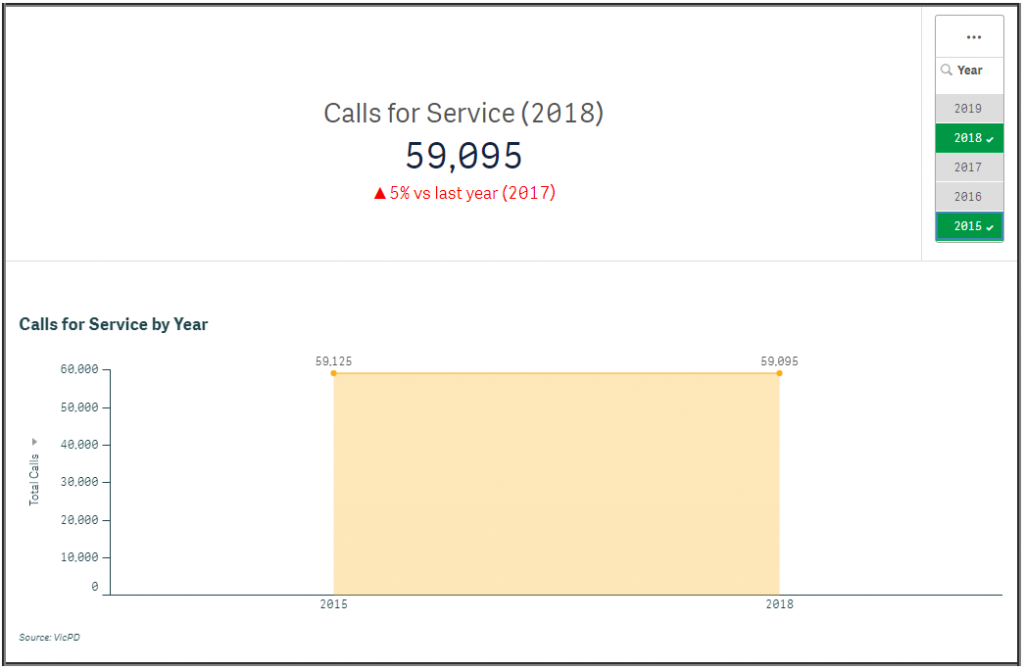
You can also select more than one year to generate a custom trend line. Here you see a comparison from 2015 to 2018.
We Want to Hear From You!
As part of our goals to improve your understanding of how we work and what measures we’re using and why, we welcome your feedback. Please email us your questions and suggestions.
Up Next
Next week, we take a closer look at the Stats Canada-generated Crime Severity Index as displayed in our Community Dashboard; an expert-created measure which shows how severe violent and non-violent crime is in Victoria and Esquimalt. Each week we’re looking at one of our Open VicPD Community Dashboard measures in detail to help you understand what we’re measuring, why we’re measuring it and how we think it helps you track our progress towards achieving our goals.
Join us on Twitter, Facebook, Instagram and VicPD.ca to come along for a deeper dive into Open VicPD.
-30-